
Paradigm Shift: Seaparating Data from Views aka Elevation Profiles aren't Ham Radio QSO Database Material

 I've been slowly but surely working through this week's ham radio QSO elevation profile project. The way I want to use the tool (Datasette) doesn't feel like a good fit for the tool. That's made things more difficult. In short, here's what I hope to achieve:

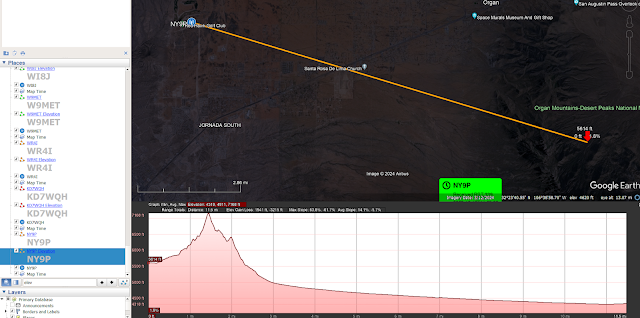
  1. Plot a partial QSO path for each contact from the transmitting station (me), about 10 wavelenghts or so out towards the receiving station, so about 200 meters or so in this case. This path should be on the kml map of the QSO This is done.
  2. Place a png picture of the elevation profile into the Datasette row for that QSO.
    1. This is what this post was about.
  3. Add this picture to the kml map as well.

So! I think I was wrong! The point of this whole operation was to have elevation profiles directly available in kml animated maps. I wanted them to be automatically included with each QSO, but my ownw specification was that they should be in the map. Not the database!

Basically, there's data, the dates, times, callsigns, and RST reports of QSOs. And then there's visulaizations of data. Things like animated KML maps, maps of F2 skips,


 and elevation profiles.


The database does not contain raw map data. It aslo does not inlcude F2 data. Especially in the case of F2 data, one day the database might contain it, but for now, the point of maps, F2 skips, and elevation profiles, (and sometimes weather radar), is to visualize what was going on during the QSO.

Now that I'm thinking about a better separation of concerns, the application has also become more simple. Where the elevation profiles belong is in the already existing—but not quite released—kml plugin. Here's how things will work:

  1. The kml plugin code will calculate the partial path, (or more likely, just require them as a field in the query).
  2. Given the partial path endpoint, the kml plugin will call out for the elevation data.
  3. Using the returned elevation data, the plugin will create a google chart visualization, targeting it to a 'who cares' div added to the Datasette page.
  4. I say 'who cares' because the real point of the chart will be to call my_chart.getImageURI to return a png of the map in text form that can be inserted in the kmkl without needing to turn it into a kmz file.
  5. The reason to care about that is that most people looking at the maps do not have access to Google Earth Pro. I think it's free at this point, but it's still an extra install. Most people do have access to Google Earth Web where I can put direct links to the kml files displayed in Google Earth Web. (Whether or not the text data encoded pictures will work there remains to be seen.)
And that's that! I'll keep you posted on the rest!


Comments

Popular posts from this blog

More Cowbell! Record Production using Google Forms and Charts

First, the what : This article shows how to embed a new Google Form into any web page. To demonstrate ths, a chart and form that allow blog readers to control the recording levels of each instrument in Blue Oyster Cult's "(Don't Fear) The Reaper" is used. HTML code from the Google version of the form included on this page is shown and the parts that need to be modified are highlighted. Next, the why : Google recently released an e-mail form feature that allows users of Google Documents to create an e-mail a form that automatically places each user's input into an associated spreadsheet. As it turns out, with a little bit of work, the forms that are created by Google Docs can be embedded into any web page. Now, The Goods: Click on the instrument you want turned up, click the submit button and then refresh the page. Through the magic of Google Forms as soon as you click on submit and refresh this web page, the data chart will update immediately. Turn up the:

Cool Math Tricks: Deriving the Divergence, (Del or Nabla) into New (Cylindrical) Coordinate Systems

Now available as a Kindle ebook for 99 cents ! Get a spiffy ebook, and fund more physics The following is a pretty lengthy procedure, but converting the divergence, (nabla, del) operator between coordinate systems comes up pretty often. While there are tables for converting between common coordinate systems , there seem to be fewer explanations of the procedure for deriving the conversion, so here goes! What do we actually want? To convert the Cartesian nabla to the nabla for another coordinate system, say… cylindrical coordinates. What we’ll need: 1. The Cartesian Nabla: 2. A set of equations relating the Cartesian coordinates to cylindrical coordinates: 3. A set of equations relating the Cartesian basis vectors to the basis vectors of the new coordinate system: How to do it: Use the chain rule for differentiation to convert the derivatives with respect to the Cartesian variables to derivatives with respect to the cylindrical variables. The chain

The Valentine's Day Magnetic Monopole

There's an assymetry to the form of the two Maxwell's equations shown in picture 1.  While the divergence of the electric field is proportional to the electric charge density at a given point, the divergence of the magnetic field is equal to zero.  This is typically explained in the following way.  While we know that electrons, the fundamental electric charge carriers exist, evidence seems to indicate that magnetic monopoles, the particles that would carry magnetic 'charge', either don't exist, or, the energies required to create them are so high that they are exceedingly rare.  That doesn't stop us from looking for them though! Keeping with the theme of Fairbank[1] and his academic progeny over the semester break, today's post is about the discovery of a magnetic monopole candidate event by one of the Fairbank's graduate students, Blas Cabrera[2].  Cabrera was utilizing a loop type of magnetic monopole detector.  Its operation is in concept very sim