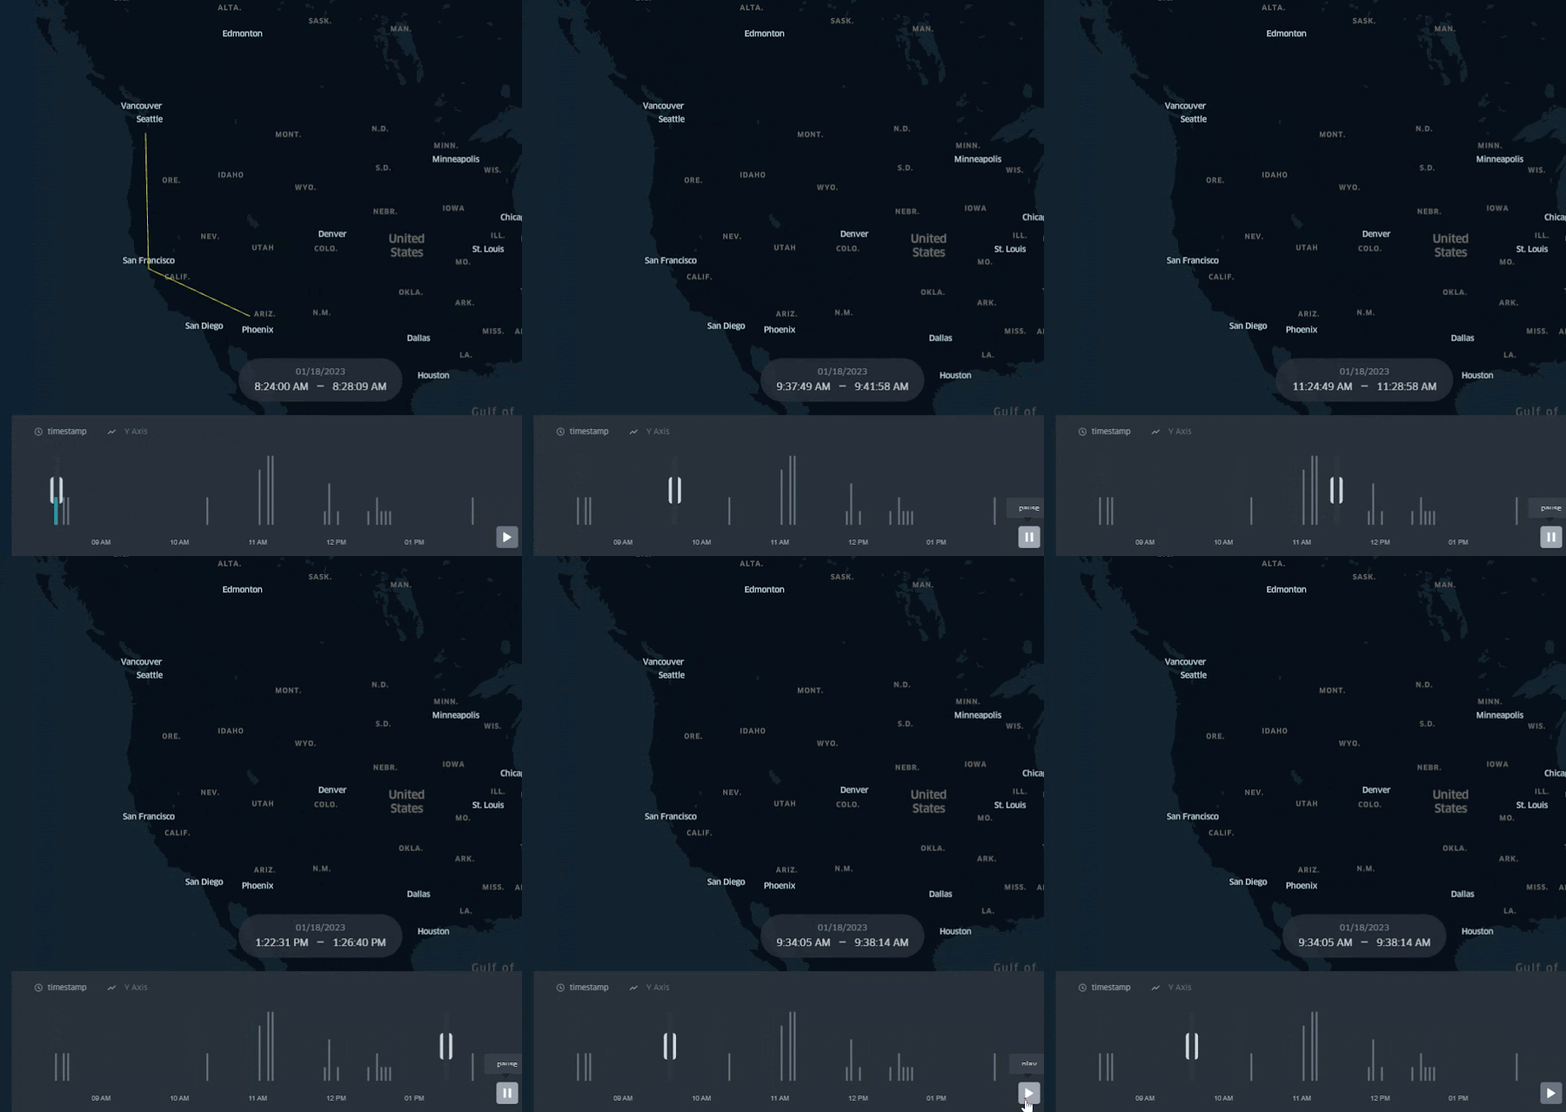
Anyone with a github account can capture their ham radio station reverse beacon network spots and map them over time using kepler.gl. I've been working from Simon Wilison's screen scraping examples to create animated maps of the Rockmite's reverse beacon network spots. I believe, (and hopefully I'm about to find out), that I've created enough documentation that others should be able to fork the project to create their own maps!
So, before I show what can be done with the tool, if you're interested, please follow the instructions, and let me know how it goes! Also, if you can't follow the instructions, or something doesn't work, please file an issue on the project, and I'll get to work on addressing it.
I'll cover this more in a future post, but here's something interesting I saw in the spotting data from the Rockmite leading into last night's NAQCC sprint. Utah and Arizona are one of the Rockmite's usual strong spots, and indeed it had been skipping into them all day
Just before the sprint was scheduled to start at 5:30 PM PST, however, the ionosphere dropped out for those locations while locations further East opened up. Kinda Cool!


Comments
Post a Comment
Please leave your comments on this topic: