Lab Book 2014_12_30
Today I
worked on getting a qualitative susceptometer up and running. By qualitative I mean that we won't be attempting
to analyze the returned data to accurately determine any characteristics of the superconducting materials that are to be studied, only the state of the materials,
and the existence, or not of a hysteresis curve for the material.
The why of it all
I’m
experimenting with a quick and dirty susceptometer that can be used with the hray
experiment to determine when we’ve quenched the superconductor. Today’s work is using a ferromagnetic core,
not a superconductor. The responses are
similar and I don’t have to worry about cooling a superconductor.
Experimental Setup
Something old and something new
I’m
pressing a General Radio 1311-A audio oscillator and a Tektronix TDS 210 into
service together.
The general
radio signal generator is being used to drive the coil surrounding the iron
core. The oscilloscope is measuring both
the signal from the General Radio source and the pickup coil on the iron core
as shown below
|
|
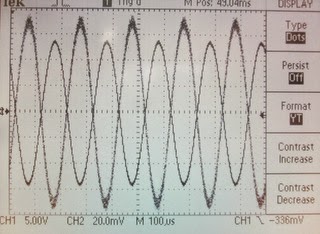
Voltage vs. time vs. frequency
In the
following waveforms, the driving voltage is on channel 1 and the response
voltage from the pickup coil is shown on channel two. Channel one is a cleaner signal than channel
two. There’s a 180 degree phase
difference between the signal just as you’d expect from Lenz’s law and the
output on the pickup coil increases with frequency as you’d expect from Faraday’s
law.
400
Hz
|
500
Hz
|
1000
Hz
|
2000
Hz
|
5000
Hz
|
10000
Hz
|
|
|
|
|
|
|
X-Y data
vs. frequency
The expected
hysteresis loop began to appear once the frequency of the generator was brought
sufficiently high. The following data
table illustrates this.
400 Hz
|
|
500 Hz
|
|
1000 Hz
|
|
2000 Hz
|
|
5000 Hz
|
|
10000 Hz
|
The
final data point at 10,000 Hz is shown below with bandwidth limiting on the
scope enabled to cut down on the signal noise:
What we’re seeing
As the
frequency of the oscillator is increased, the loop is opening up because the
ferromagnetic response of the core can’t track quickly enough with the driving
current. Consequently there’s a phase
difference between the two signals and this appears in the x-y display mode as
a gradually opening loop.
It should
be noted that the signal isn’t large enough to cause the iron core to
saturate. If it was, we’d see horizontal
flat extensions at either corner of the loop.
A power amplifier may be added to the arrangement tomorrow to cause saturation.
Here’s a
set of hysteresis curves that depend on frequency[1]. Notice that the enclosed loop becomes wider as
the frequency increases, just as in the data shown above.
How Ferromagnets and
Superconductors are Alike, (well, one way anyway)
I
mentioned that ferromagnets behaved in a similar manner to superconductors when
subjected to a magnetic field. It’s because
their hysteresis curves don’t look too much different. Here’s a hysteresis curve[2] measured for
superconducting Pb. The square is the
theoretically ideal response. The curved
lines are the actual response of the superconductor.
References:
1. Jiles, J.C., “Frequency dependence of
hysteresis curves in conducting magnetic materials
”, Journal
of Applied Physics 76, 5849 (1994) http://dx.doi.org.lib-ezproxy.tamu.edu:2048/10.1063/1.358399
2.
Rjabinin, Shubnikow, “Dependence
of Magnetic Induction on the Magnetic Field in Supraconducting Lead”, Nature,
134, (1934), 286-287


Comments
Post a Comment
Please leave your comments on this topic: