Google Visualization API: Gotchas

Updated March 26, 2008 12:37 PM CMT

I'm coming up to speed on the new Google Visualization APIs this week like a lot of other people. As I'm working through my new application that uses this API and Google Docs spreadsheets, I'm running into some issues that aren't covered in the online documentation for the API. I'll post those issues along with their resolution here, so if you run into problems, this is a good place to look. If you run into problems that aren't covered, please add them to the comments section. Of course, the first place to look if you run into issues is on the Google Visualization API Group.


Column labels don't work like you might think they should

Throughout the Query Language Reference the examples use the labels from the following table:

name
string

dept
string

lunchTime
timeofday

salary
number

hireDate
date

age
number

isSenior
boolean

seniorityStartTime
datetime

John

Eng

12:00:00

1000

2005-03-19

35

true

2007-12-02 15:56:00

Dave

Eng

12:00:00

500

2006-04-19

27

false

null

Sally

Eng

13:00:00

600

2005-10-10

30

false

null

Ben

Sales

12:00:00

400

2002-10-10

32

true

2005-03-09 12:30:00

Dana

Sales

12:00:00

350

2004-09-08

25

false

null

Mike

Marketing

13:00:00

800

2005-01-10

24

true

2007-12-30 14:40:00

Examples are then presented like:

select name where salary > 700

I interpreted this to mean that the first row of my spreadsheet table was the name of the equivalent database field.

However, this is not the case. When using the API with a spreadsheet, the name is the id of the column. So, if you copied the above table into a spreadsheet, the correct query would be:

select A where D > 700


You can't query for a whole column ala B:B

The API will return an 'access denied' error message.

Experimental: You can get around this by querying the results of an array function within the spreadsheet. So, B:B won't work, but the following should:

B

C

D

E


=unique(B:B)

=rows(unique(B:B))


First, query cell D1 to determine how many unique rows there are. Then, use that number to construct a Query object for column C with only the number of rows you need.

Update! Thanks VizGuy!
You can query an entire column at once, just not using B:B. First remove the range specification from the data source URL so it reads like:

...google.com/tq?key=ABCD...

Then, query the entire column using a statement like:
query.setQuery("select B where B != ''");


You can use the same query string for different spreadsheet ranges

The documentation of the 'Hello World' application says to get a query string like this:

you can create and send a query to the data source. The data source is identified by a URL that is provided by the data source application. For example, to get the data source URL from a Google Spreadsheet, do the following:

  1. Open a spreadsheet.
  2. Insert a gadget, select the range of cell you want to read.
  3. In the gadget title, click the arrow icon on top right.
  4. select 'get query data-source URL' from the popup menu.


The data source URL for a Google Spreadsheet will look something like http://spreadsheets.google.com?...&key=123ABC

The part of the query string that's been hidden by the ellipses above looks like:

google.com/tq?range=B1:B10&key=pvFX...

where 'B1:B10' is the original range you selected for the gadget they mention above. The key in the string is dependent on the spreadsheet, not the selection range. So, once you have a query string for the spreadsheet, the range can be modified, (to B1:C12 for example), without any ill effects, and without the need to get the query string from the gadget again. More details about the 'tq?' modifier shown above can be found in the documentation.


Blogger.com Specific: You can run scripts in a post, it just takes some finesse

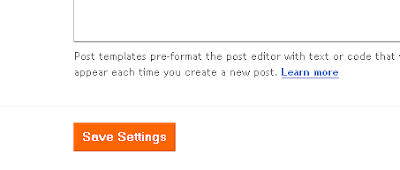
The documentation of the 'Hello Worl When I started playing with javascript on these pages, I spent half a day trying to find out why my scripts didn't work. It turns out that blogger.com turns linefeeds into '' tags, even if you're editing in the 'Edit Html' tab. To get around this issue, turn off 'convert line breaks in the 'formatting' section of the 'Settings' tab.

First:

Then:


Finally:


Be Warned:

This setting will retro-actively be the same for all your other posts. That means that there may be subtle, and not-so-subtle formatting differences in your published posts while this setting is changed. The good news is that these changes revert back to normal when you revert the setting.

Also, always keep a record of your scripts on your own machine. I've seen scripts get munged with br tags by blogger.com anyway.


The Permanent Fix:

When your script is ready to go, remove all line-feeds, and paste it into the post as a single long line.


Gotcha Number 5 is so convoluted it got its own page.

See the Gotcha #5 page here.


Comments

Popular posts from this blog

More Cowbell! Record Production using Google Forms and Charts

First, the what : This article shows how to embed a new Google Form into any web page. To demonstrate ths, a chart and form that allow blog readers to control the recording levels of each instrument in Blue Oyster Cult's "(Don't Fear) The Reaper" is used. HTML code from the Google version of the form included on this page is shown and the parts that need to be modified are highlighted. Next, the why : Google recently released an e-mail form feature that allows users of Google Documents to create an e-mail a form that automatically places each user's input into an associated spreadsheet. As it turns out, with a little bit of work, the forms that are created by Google Docs can be embedded into any web page. Now, The Goods: Click on the instrument you want turned up, click the submit button and then refresh the page. Through the magic of Google Forms as soon as you click on submit and refresh this web page, the data chart will update immediately. Turn up the:

Cool Math Tricks: Deriving the Divergence, (Del or Nabla) into New (Cylindrical) Coordinate Systems

Now available as a Kindle ebook for 99 cents ! Get a spiffy ebook, and fund more physics The following is a pretty lengthy procedure, but converting the divergence, (nabla, del) operator between coordinate systems comes up pretty often. While there are tables for converting between common coordinate systems , there seem to be fewer explanations of the procedure for deriving the conversion, so here goes! What do we actually want? To convert the Cartesian nabla to the nabla for another coordinate system, say… cylindrical coordinates. What we’ll need: 1. The Cartesian Nabla: 2. A set of equations relating the Cartesian coordinates to cylindrical coordinates: 3. A set of equations relating the Cartesian basis vectors to the basis vectors of the new coordinate system: How to do it: Use the chain rule for differentiation to convert the derivatives with respect to the Cartesian variables to derivatives with respect to the cylindrical variables. The chain

The Valentine's Day Magnetic Monopole

There's an assymetry to the form of the two Maxwell's equations shown in picture 1.  While the divergence of the electric field is proportional to the electric charge density at a given point, the divergence of the magnetic field is equal to zero.  This is typically explained in the following way.  While we know that electrons, the fundamental electric charge carriers exist, evidence seems to indicate that magnetic monopoles, the particles that would carry magnetic 'charge', either don't exist, or, the energies required to create them are so high that they are exceedingly rare.  That doesn't stop us from looking for them though! Keeping with the theme of Fairbank[1] and his academic progeny over the semester break, today's post is about the discovery of a magnetic monopole candidate event by one of the Fairbank's graduate students, Blas Cabrera[2].  Cabrera was utilizing a loop type of magnetic monopole detector.  Its operation is in concept very sim