 Summary:
New to the experiment? Scroll to the bottom to see background and get caught up.
Lab Book 2014_07_14
Lab Book 2014_07_14 Hamilton Carter
I’m working on debugging the dynode divider which appears to
have been damaged last week, probably by running too much voltage on the power
supply attached to it. I came across the
following spectrum that looks great given the nature of the spectra that may be
present in the experiment. The
prediction of the maximum possible radiated energy via h-rays does not mention
anything about what the overall spectrum will look like. If we have a maximum energy of 187 keV, we could
also get radiation anywhere below that level.
In the following spectra from the Harshaw
manual, you can see that the exact detector that is to be used can see
radiation all the way down to the 32 keV Barium K X-ray line.

I found a thesis
where the Harshaw 12S12/E was used.
We have a 12S12/3. I’m not sure
how they’re related yet. In the thesis,
a Dumont 6363 photomultiplier tube was used.
There is also a schematic for
the dynode voltage divider chain that was used with the Dumont 6363.

I’ll check these resistor values against the ones in the
dynode divider if necessary. I found a second
thesis that mentions using a supply voltge of 900 rather than the 1000
Volts mentioned in the first thesis, (see the figure above).
I also found a paper
that mentions the Harshaw 12S12/3 specifically. The is the model that we have. The paper mentions another key piece of
information. The aluminum housing of the
crystal is 0.5 mm thick and is made of spun aluminum. The window itself if listed as 0.010 inches
thick at another web site.
On a mostly side note, this report is kind of interesting as
to what is available for history of physics research. It’s the equipment inventory for a
nuclear rocket project performed by General Aerojet.
In this
report, the PMT is listed as a RCA 8054.
In this LANL
report written by Ellery Storm, the PMT is also listed as an RCA 8054.
This might be a good reference for supplementing with film
detectors. It was authored by Ellery
Storm.
Resistor color code tool used to check resistor values:
Source mentioning that tube is in apparatus
|
Tube Type
|
Max Anode/
Cathode Voltage |
Max Consecutive Dyn V
|
2500 V
|
300 V
|
||
2000 V
|
250 V
|
||
1800 V
|
Not specified
|
||
The following pictures detail what the voltage divider chain
being used to drive the PMT looks like:

This one details the high voltage input and its associated
55.6 ohm resistor.

This is a side view of the same input. The identical resistors shown in the
foreground are part of the dynode voltage divider chain, see the schematic
below.

This picture continues along the divider chain. Note the capacitors that are connected in
parallel across the last few dynode resistors.
They are omitted in the hand drawn schematic below.
Finally, the green wire connects the plate/anode of the PMT to
the pulse output that is used by the QVT.
A hand drawn schematic of the divider chain follows:

The pinouts of both RCA tubes and the DuMont tube are all
identical and can be seen below.

Dumont Pinout

RCA Pinout
I setup the detector to take yet more data on the Cs 137
source this afternoon. I’ll have the
data in the morning. Here’s what the spectrum
was up to when I left for the evening.
The key difference here is that the tube is biased to 2000 V
instead of 2600 V. The arcing from the
tube to my hand has stopped at this bias voltage.

The spectrum looks like it is already exhibiting two peaks
after an hour or so of taking data.
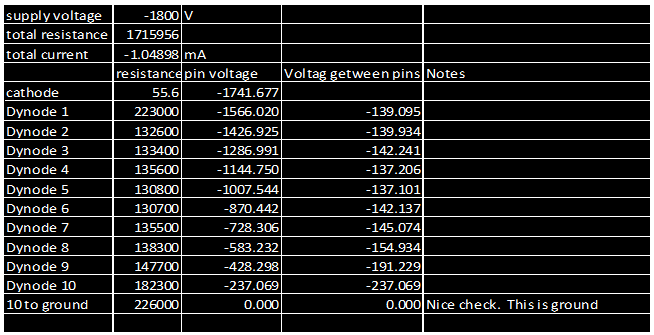
Finally, a spreadsheet
was made to calculate the voltages on the dynodes. A sample output is shown below.
References:
These are some of the original source links for the reports
mentioned above. Since Word tries to
open pdfs in Explorer instead of Chrome, all the links in the text are to
Google Drive locations.
Ellery Storm report
I thought I remembered the name Ellery Storm and it turns
out he wrote a book
of stories about New Mexico.
Harshaw Manual
RCA 8054 manual original site:
Background
Hirsch's theory of hole superconductivity proposes a new BCS-compatible model of Cooper pair formation when superconducting materials phase transition from their normal to their superconducting state[1]. One of the experimentally verifiable predictions of his theory is that when a superconductor rapidly transitions, (quenches), back to its normal state, it will emit x-rays, (colloquially referred to here as H-rays because it's Hirsch's theory).
A superconductor can be rapidly transitioned back to its normal state by placing it in a strong magnetic field. My experiment will look for H-rays emitted by both a Pb and a YBCO superconductor when it is quenched by a strong magnetic field.
A superconductor can be rapidly transitioned back to its normal state by placing it in a strong magnetic field. My experiment will look for H-rays emitted by both a Pb and a YBCO superconductor when it is quenched by a strong magnetic field.
This series of articles chronicles both the experimental lab work and the theory work that’s going into completing the experiment.
The lab book entries in this series detail the preparation and execution of this experiment… mostly. I also have a few theory projects involving special relativity and quantum field theory. Occasionally, they appear in these pages.
The lab book entries in this series detail the preparation and execution of this experiment… mostly. I also have a few theory projects involving special relativity and quantum field theory. Occasionally, they appear in these pages.
Call for Input
If you have any ideas, questions, or comments, they're very welcome!
References
1. Hirsch, J. E., “Pair production and ionizing radiation from superconductors”, http://arxiv.org/abs/cond-mat/0508529
Comments
Post a Comment
Please leave your comments on this topic: