
Paradigm Shift: Seaparating Data from Views aka Elevation Profiles aren't Ham Radio QSO Database Material

 I've been slowly but surely working through this week's ham radio QSO elevation profile project. The way I want to use the tool (Datasette) doesn't feel like a good fit for the tool. That's made things more difficult. In short, here's what I hope to achieve:

  1. Plot a partial QSO path for each contact from the transmitting station (me), about 10 wavelenghts or so out towards the receiving station, so about 200 meters or so in this case. This path should be on the kml map of the QSO This is done.
  2. Place a png picture of the elevation profile into the Datasette row for that QSO.
    1. This is what this post was about.
  3. Add this picture to the kml map as well.

So! I think I was wrong! The point of this whole operation was to have elevation profiles directly available in kml animated maps. I wanted them to be automatically included with each QSO, but my ownw specification was that they should be in the map. Not the database!

Basically, there's data, the dates, times, callsigns, and RST reports of QSOs. And then there's visulaizations of data. Things like animated KML maps, maps of F2 skips,


 and elevation profiles.
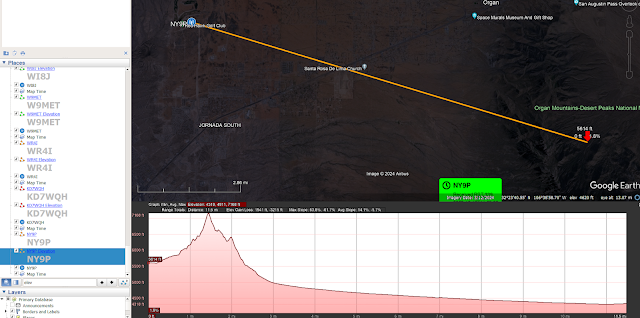


The database does not contain raw map data. It aslo does not inlcude F2 data. Especially in the case of F2 data, one day the database might contain it, but for now, the point of maps, F2 skips, and elevation profiles, (and sometimes weather radar), is to visualize what was going on during the QSO.

Now that I'm thinking about a better separation of concerns, the application has also become more simple. Where the elevation profiles belong is in the already existing—but not quite released—kml plugin. Here's how things will work:

  1. The kml plugin code will calculate the partial path, (or more likely, just require them as a field in the query).
  2. Given the partial path endpoint, the kml plugin will call out for the elevation data.
  3. Using the returned elevation data, the plugin will create a google chart visualization, targeting it to a 'who cares' div added to the Datasette page.
  4. I say 'who cares' because the real point of the chart will be to call my_chart.getImageURI to return a png of the map in text form that can be inserted in the kmkl without needing to turn it into a kmz file.
  5. The reason to care about that is that most people looking at the maps do not have access to Google Earth Pro. I think it's free at this point, but it's still an extra install. Most people do have access to Google Earth Web where I can put direct links to the kml files displayed in Google Earth Web. (Whether or not the text data encoded pictures will work there remains to be seen.)
And that's that! I'll keep you posted on the rest!


Comments

Popular posts from this blog

Cool Math Tricks: Deriving the Divergence, (Del or Nabla) into New (Cylindrical) Coordinate Systems

Now available as a Kindle ebook for 99 cents ! Get a spiffy ebook, and fund more physics The following is a pretty lengthy procedure, but converting the divergence, (nabla, del) operator between coordinate systems comes up pretty often. While there are tables for converting between common coordinate systems , there seem to be fewer explanations of the procedure for deriving the conversion, so here goes! What do we actually want? To convert the Cartesian nabla to the nabla for another coordinate system, say… cylindrical coordinates. What we’ll need: 1. The Cartesian Nabla: 2. A set of equations relating the Cartesian coordinates to cylindrical coordinates: 3. A set of equations relating the Cartesian basis vectors to the basis vectors of the new coordinate system: How to do it: Use the chain rule for differentiation to convert the derivatives with respect to the Cartesian variables to derivatives with respect to the cylindrical variables. The chain ...

The Alcubierre Warp Drive Tophat Function and Open Science with Sage

I transferred yesterday's Mathematica file with the Alcubierre warp drive[2] line element and space curvature calculations to the  +Sage Mathematical Software System  today, (the files been  added to the public repository [3]).  If you haven't used Sage before, it's a Python based software package that's similar in functionality to Mathematica.  Oh, and it' free.  I also worked a little more on understanding the theory, but frankly, I made far more progress with the software than the theory.  What follows will be a little more of the Alcubierre theory, plus, a cool Sage interactive demo of one of the Alcubierre functions[1], as well as a bit about my first experience with using Sage. Theory The theory is fun, but it's moving slowly.  Here's the chalk board from this morning's discussion Alcubierre setup the derivation using something called the 3+1 formalism which means we consider space to be flat, (in this case), slices that are labelled ...

How Many Files Can You Add to a GPT Project? An Interview with GPT-5 on Limits, Context Engineering Tips, and Chats

 Setting the scene: I’m tinkering with Project TouCans, knee-deep in radio logs, SQLite dumps, and Cesium code. Naturally, I’m wondering if shoving all this into one GPT Project is a recipe for brilliance… or for disaster. So I turn to Vril — you know, after Brainy from the Legion of Super-Heroes , because what else do you call your AI sidekick who always has the answers? Time to ask him straight up. [ As an aside, yes, GPT-5 has decided to sometimes call me Vail. I'm not sure why to be honest. Also, I asked Vril, er GPT-5, to write up our interview for me. Apparently, me asking it to 'Bro' up a few stories, just for fun, has convinced Vril that I use 'Like,' more than I actually might. ] Me (Vail): So Vril, how many files can I throw into a GPT Project before it just starts choking? Like, is there some magic number where the context window taps out and everything falls apart? GPT-5 (Vril): Great question. There’s no single hard file limit. What matters is ...